Taiji Dolphin Drive Hunt Seasonal Data
These charts show data collected by observers in Taiji. Observers include but are not limited to members of Sea Shepherd Cove Guardians, members of Ric O’Bary Dolphin Project Cove Monitors, Positive Change for Marine Life, Flipper, 海洋哺乳類を守る会~Action for Marine Mammals~ as well as independent observers. Where data was also available directly from the Issana Fisheries Union it was also used.
2016/2017 Taiji Dolphin Drive Hunt Season
The following charts represent monthly data. These charts look at monthly breakdown the species taken for both slaughter and live captive sale, percentage of quota used for each species, the number of blue and red days, as well as, the daily conditions such as rainy/stormy weather preventing a hunt or when a drive occurs but the dolphins manage to escape the hunters and the number of blue and red cove days in total and consecutive for that month.
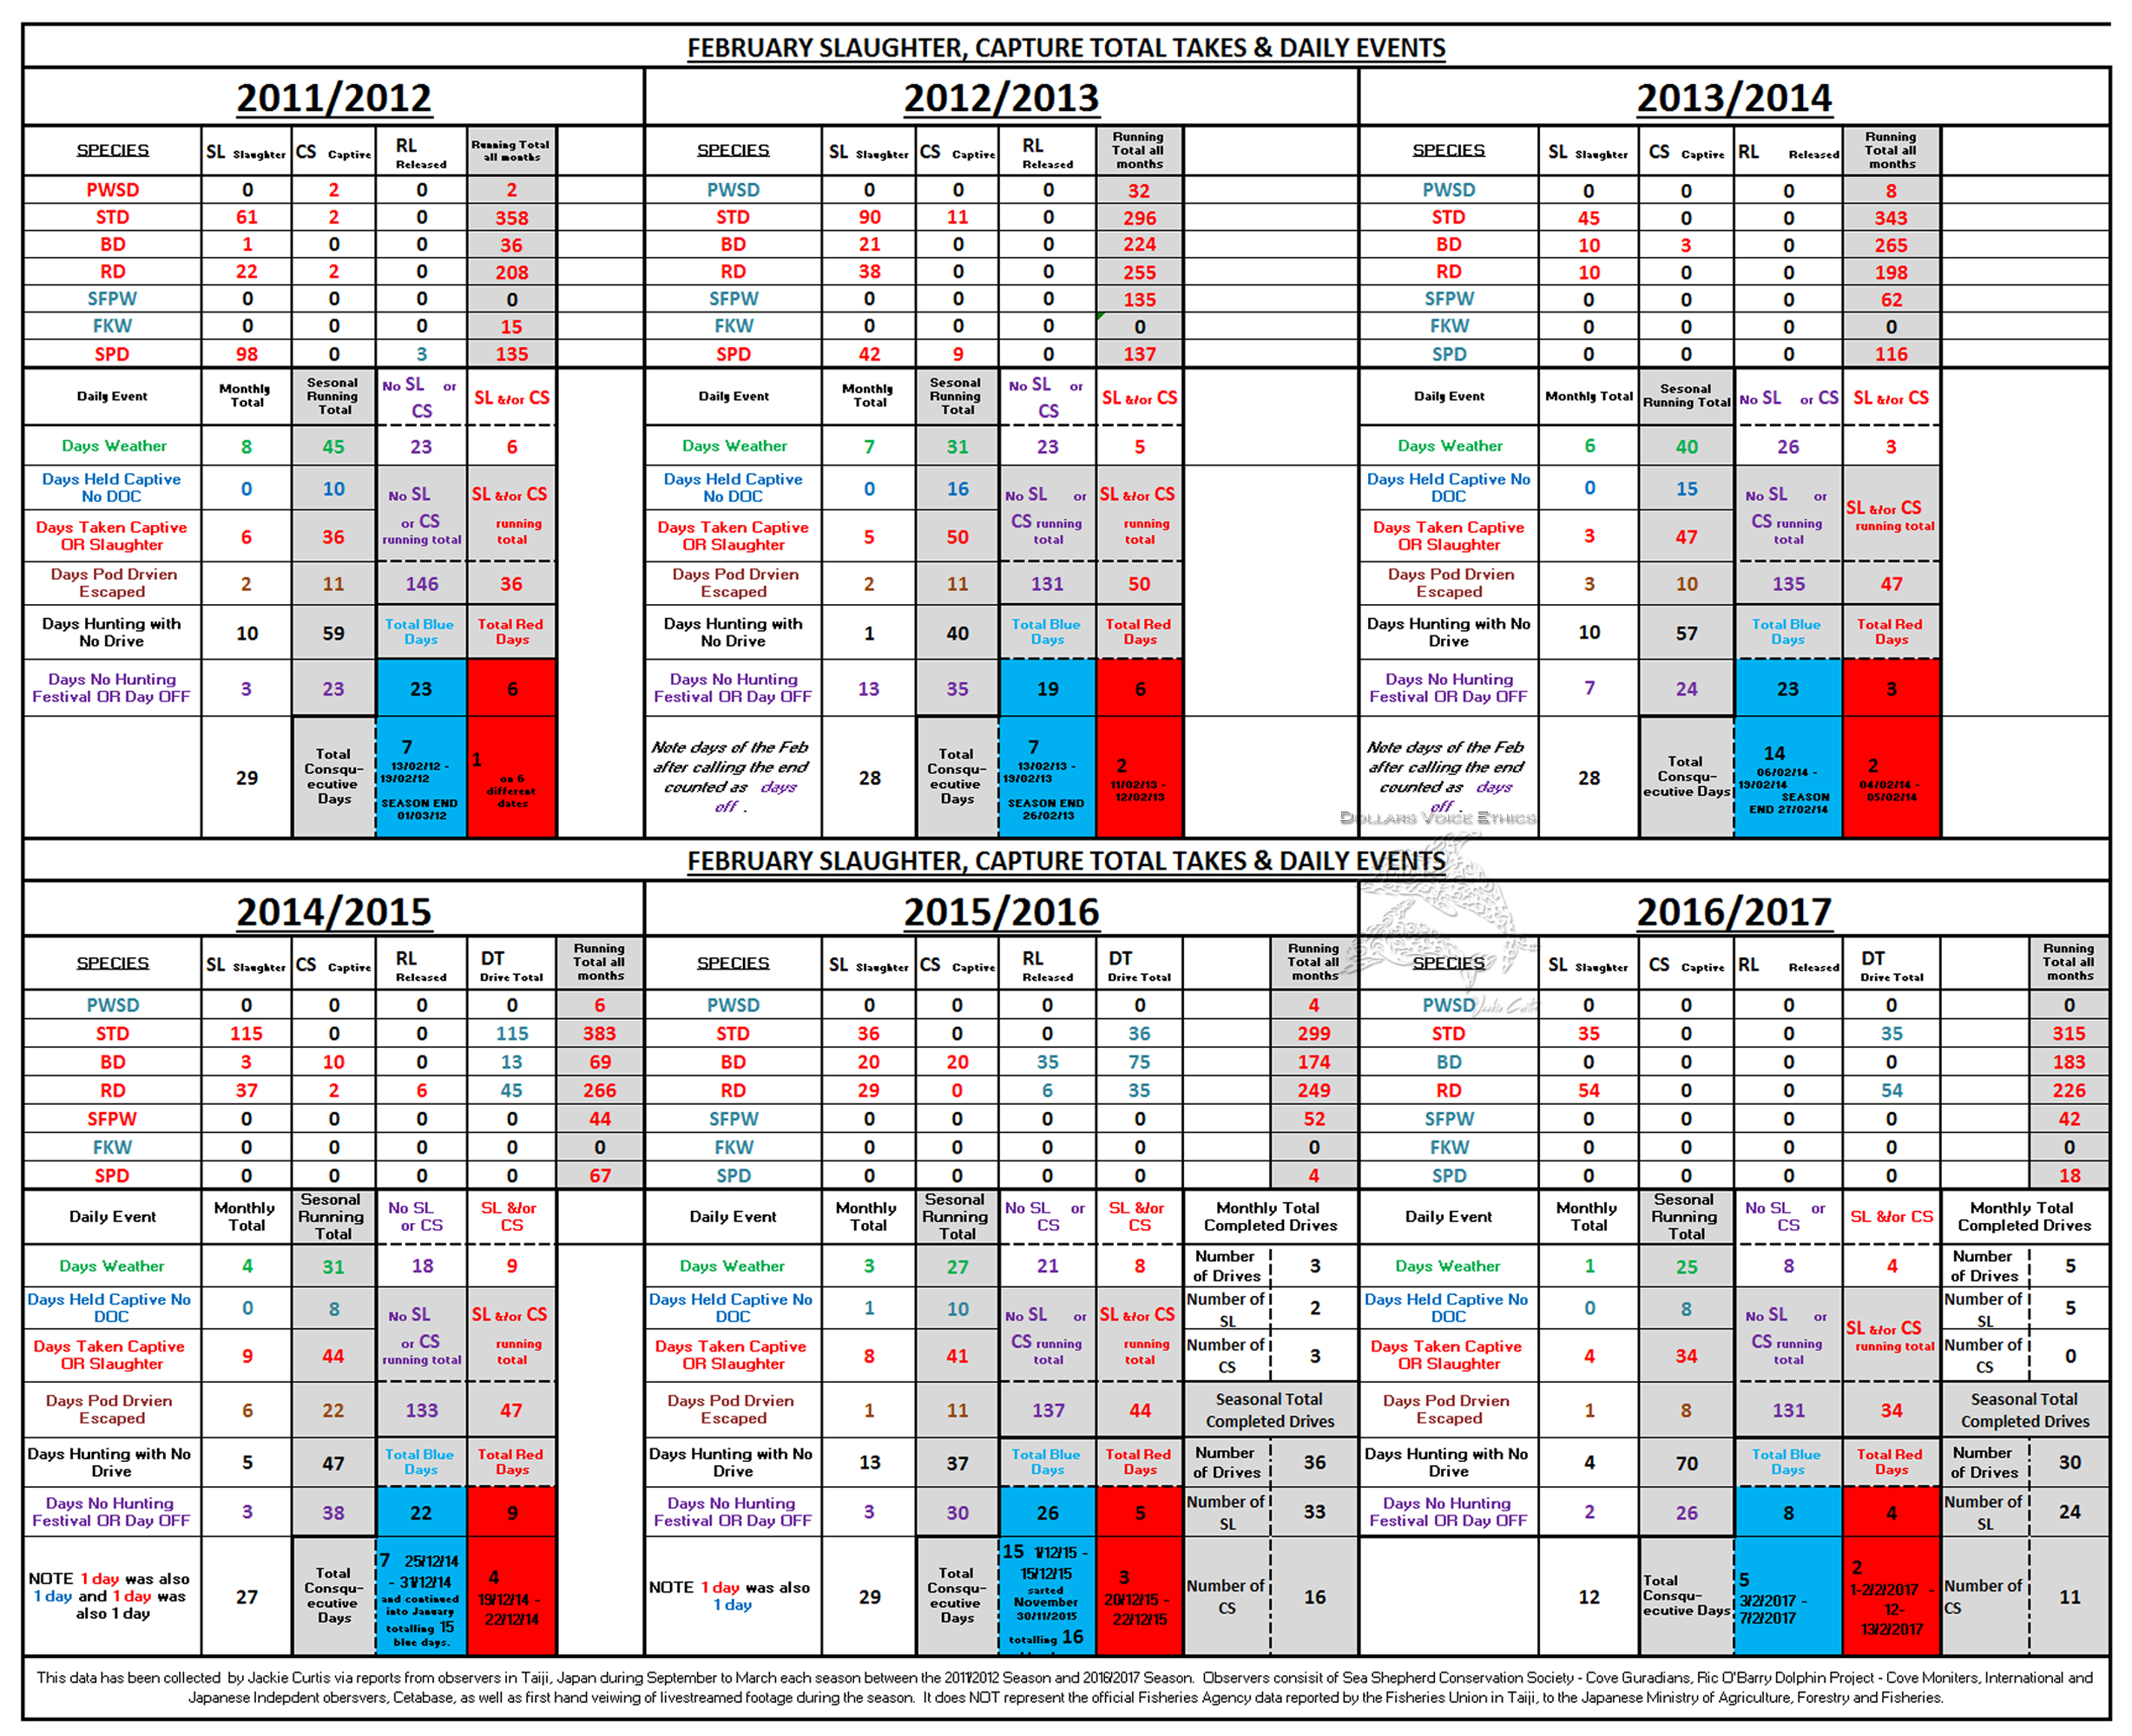
February Monthly Data between 2011/2012 to 2016/2017
Last Updated – 13/02/2017
 Last Updated – 13/02/2017
Click the image to enlarge the chart. (You can enlarge it twice.)
January Monthly Data between 2011/2012 to 2016/2017
Last Updated – 31/01/2017
 Last Updated – 31/01/2017
Click the image to enlarge the chart. (You can enlarge it twice.)
December Monthly Data between 2011/2012 to 2016/2017
Last Updated – 31/12/2016
 Updated 31/12/2016
Click the image to enlarge the chart. (You can enlarge it twice.)
November Monthly Data between 2011/2012 to 2016/2017
Last Updated – 30/11/2016
 Updated 30/11/2016
Click the image to enlarge the chart. (You can enlarge it twice.)
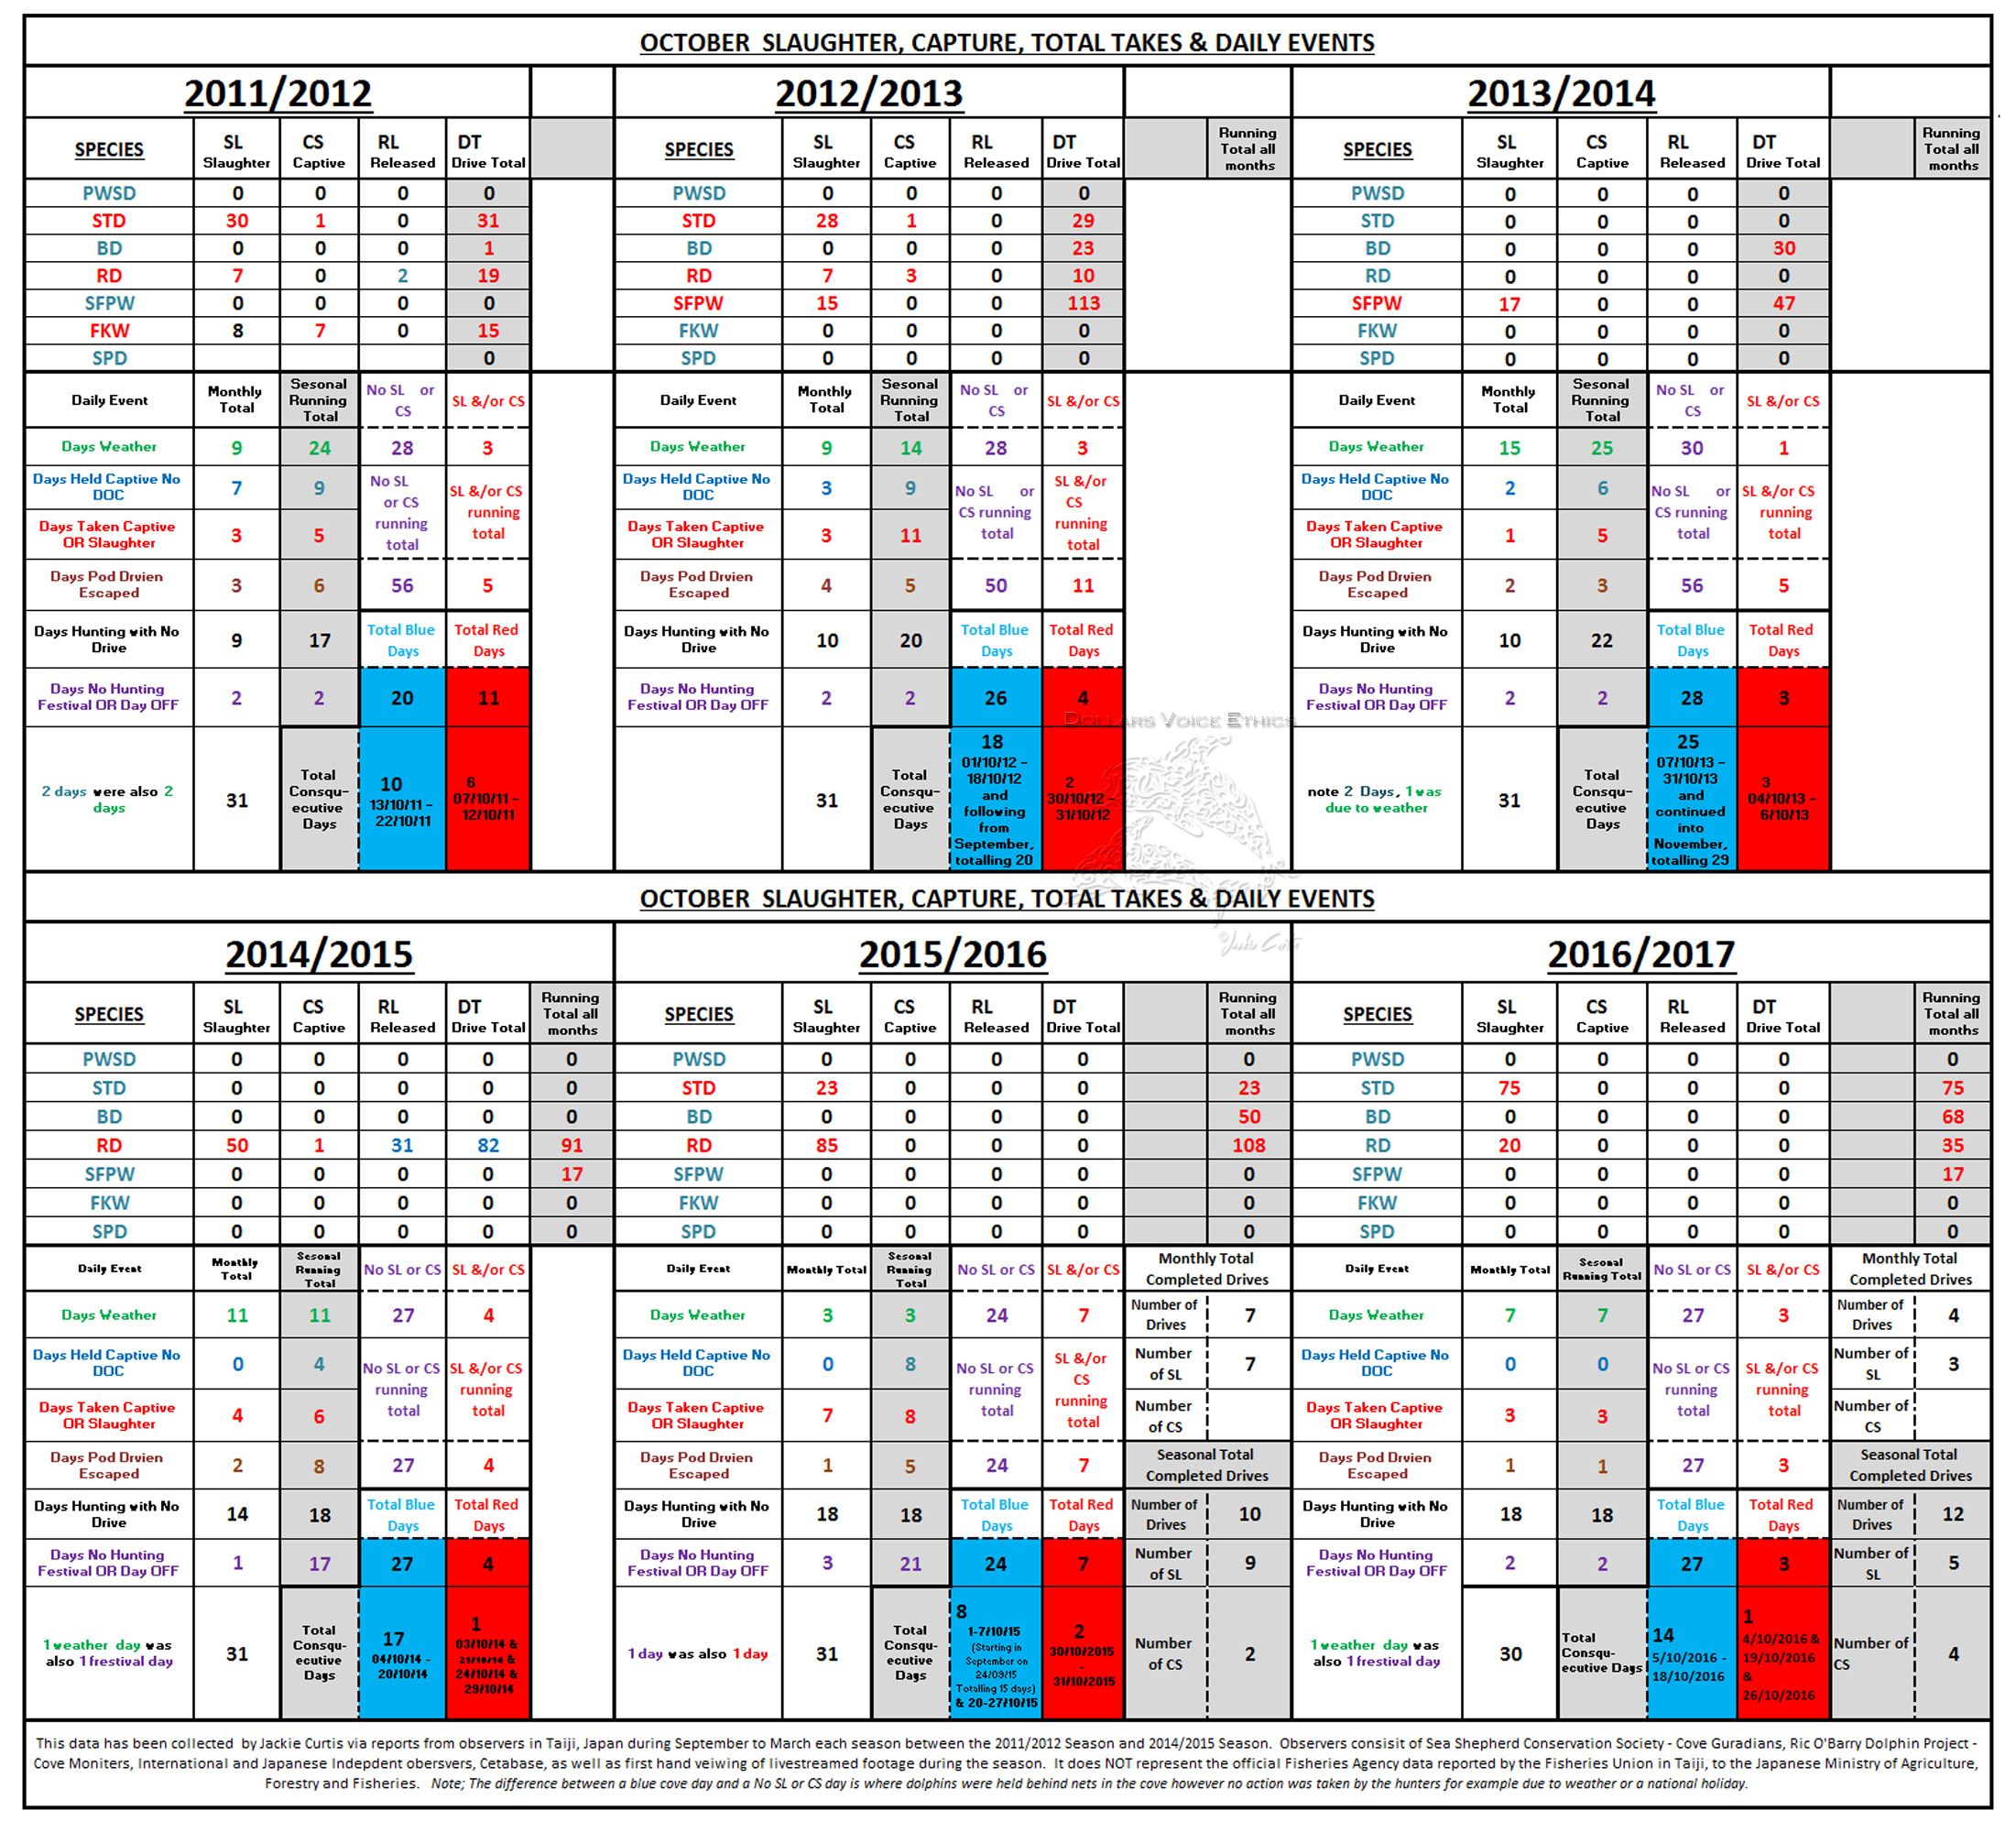
October Monthly Data between 2011/2012 to 2016/2017
Last Updated – 30/10/2016
 Updated 30/10/16
Click the image to enlarge the chart. (You can enlarge it twice.)
September Monthly Data between 2011/2012 to 2016/2017
Last Updated – 30/09/2016
 updated 30/09/2016
Click the image to enlarge the chart. (You can enlarge it twice.)
2011/2012 to 2016/2017 ALL MONTHS Seasonal Data
Last Updated – 13/02/2017
The data compares quotas, take totals, slaughters, live captive take and what have become known as blue and red days at the cove as well as the dates of the first and last hunts and drives of the season.
 Last Updated – 13/02/2017
Click the image to enlarge the chart. (You can enlarge it twice.)
All charts on this page have been prepared by Jackie Curtis and show data collected by observers in Taiji. Observers include but are not limited to members of; Sea Shepherd Cove Guardians, Ric O’Barry Dolphin Project Cove Monitors, Positive Change for Marine Life, Flipper, 海洋哺乳類を守る会~Action for Marine Mammals~ as well as other independent international and Japanese observers. Where data was also available directly from the Issana Fisheries Union it was also used. The data is also compared with the data provided by Cetabase to check consistency and where differences occur they confirmed and explained. Please click each chart to open it in a larger format.
Why I started collecting the data coming out of Taiji during the hunting season.
I first started to collect as much data I could coming out of Taiji at the beginning of the 2011/2012 hunting season, after first finding out about the hunts and actively following and sharing what I could during the 2010/2011 hunting season.
Having known nothing about the dolphin drive hunts the entire time I was living in Japan, I was horrified to learn of the dolphin drives and had very little knowledge which for me only increased the feelings of helplessness one can not help but feel when faced with such horrors. I knew I had to find a way to get bare, cold hard facts, because I could see that while it was being shrouded in emotion outburst some of which were understandable, others were nothing but nasty vitriol, racial intolerance, hatred and speculation, that would never make it into the general public of Japan for mass consumption. I knew this first hand, there was no way I would have taken the time to stop and read or watch something wrapped in comments of generalized detest towards the whole country and all its people, neither would my friends and adopted family for nearly a decade. Especially when time is most valuable in the Tokyo city lifestyle, late nights racing for the last train and early starts are just a part of the everyday for most of the population of Japan that lives condensed in its cities.
So I started a spreadsheet, six years later I have a database full of spreadsheets, tracking everything I can from the daily activities of the hunters, the species and numbers of dolphins taken either for slaughter or live sale to the captive industries, to the international export data provided by the Japanese Ministry of Finance on their Trade Statistics website.
I obviously wasn’t alone in my need for more clarity and factual information over speculation as, at the end of the following dolphin hunting season, my first year’s data in place, I discovered the Ceta-Base website and what wonderful tool that is, if you don’t know the site you should check it out, it goes way beyond Taiji and covers the captive marine mammal industry world over. Over the years I have contacted Ceta-Base and visa versa to compare our data coming out of Taiji to make sure we are providing the most factual, timely data possible. Things understandably can very easily get confusing when a drive, slaughter, live capture selection process or transportation for live sale. With several organizations and independent individuals on the ground reporting on the hunts and industries they service. So it’s been great to have a second set of eyes and ears to sift through the information with on occasion. At time our data can vary as we may use a different formula with the information coming from multiple resources however these differences are usually minimal and if requested an explanation of why there is a discrepancy in the data on occasion can be provided.
Check out these other reports;
A Veterinary and Behavioral Analysis of Dolphin Killing Methods Currently Used in the “Drive Hunt” in Taiji, Japan. by Andrew Butterworth , Philippa Brakes , Courtney S. Vail & Diana Reiss
![]()